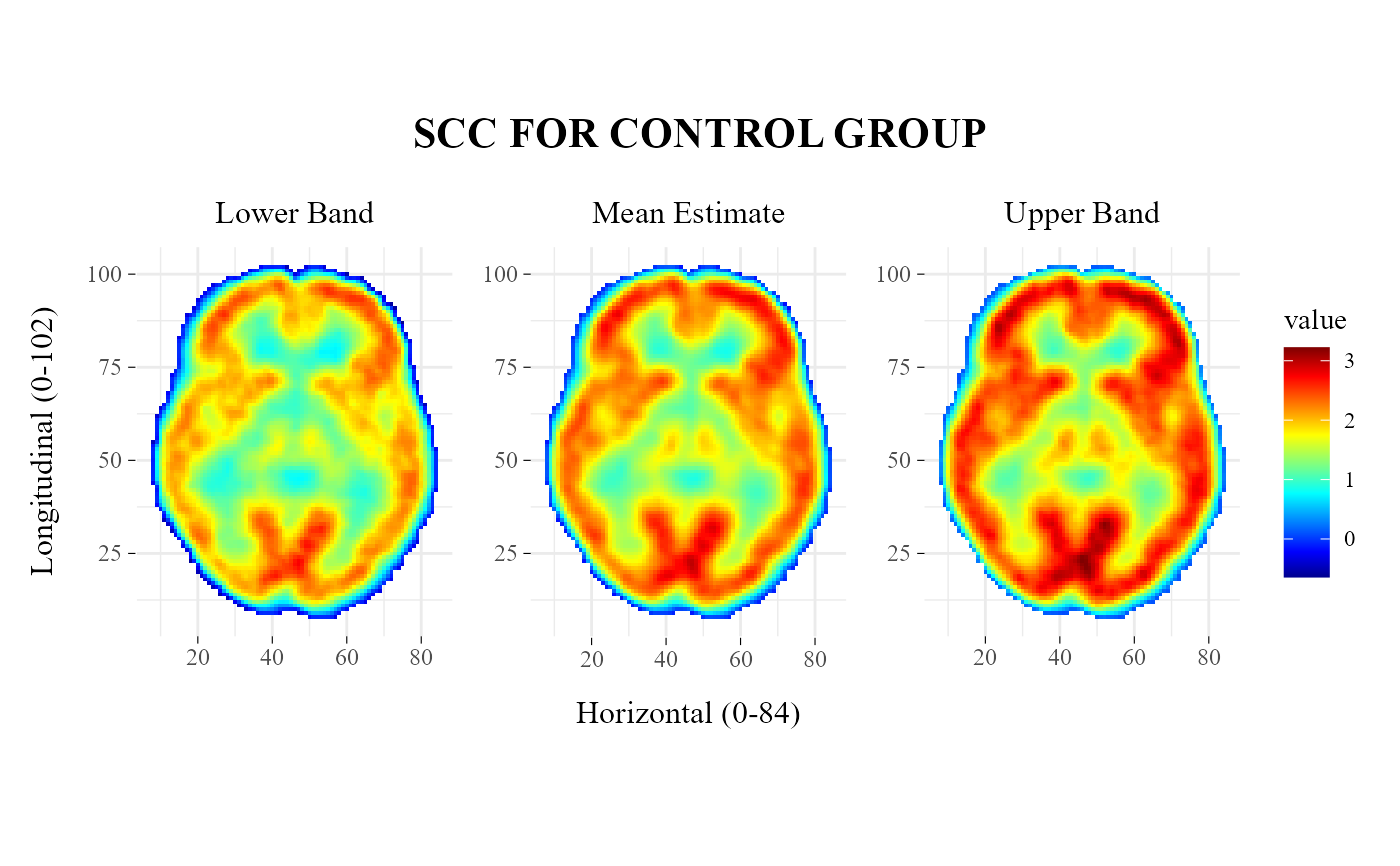
This function visualizes the lower band, mean estimate, and upper band from a single-group Simultaneous Confidence Corridor (SCC) result. It returns a three-panel plot showing the estimated mean function and its confidence bands over the neuroimaging domain.
Arguments
- scc
A list-like SCC result object, typically returned by
ImageSCC::scc.image(), containing at least the componentsZ,ind.inside.cover,scc, andYhat.- title
character, title shown above the panel. IfNULL, the default title is"SCC FOR GROUP 1".- zlim
Either
"auto"to compute color limits from the plotted values, or a numeric vector of length 2 specifying the lower and upper limits of the fill scale.- palette
character, color palette used in the heatmaps. Supported values are"nih","viridis", and"gray".
Value
A patchwork/ggplot object containing three aligned panels:
lower SCC band,
mean estimate,
upper SCC band.
Details
The three panels are displayed using a shared color scale so that the lower band, mean estimate, and upper band can be compared directly.
The function assumes that the second slice of scc$scc[, , 2] corresponds
to the SCC bands for the default significance level used in the package workflow.
See also
sccOneGroup for the example single-group SCC object used in the examples. SCCcomp for a two-group SCC example object. plotSCCcomparisonPanel for two-group SCC visualization. plotValidationPanel for SCC versus SPM performance visualization.
Examples
data("sccOneGroup", package = "neuroSCC")
plotSCCpanel(sccOneGroup, title = "SCC FOR CONTROL GROUP")